
Even though home values are appreciating to record levels, fewer homeowners are choosing to sell.
During the Great Recession, homeowners across the nation watched the housing market take a brutal pounding as their equity vanished in a blink. Many lost their homes to foreclosures or short sales. Everybody was either personally burned or they knew somebody who experienced the painful sting of the downturn. No one wants to go through that again. As a result, homeowners remain in their homes for a lot longer. They are content in keeping their home. There are fewer homeowners who opt to sell every year, and even with record home values, the trend continues.
From 2000 to 2008, there were an average of 1,347 more homes that came on the market every single month compared to the past 10 years. That is an extra 16,158 sellers every year, 39% more. That has been the storyline for more than a decade, not enough homes are offered for sale. It is not just an Orange County phenomenon or isolated to just Southern California. Nor is it unique to the state of California. A lack of sellers has been a national issue that has plagued the real estate market and made it very difficult for buyers to find a home.
The lack of supply and years of red-hot demand, fortified by record low interest rates (especially since the start of the COVID-19 pandemic), has resulted in homes appreciating to record levels in Orange County, erasing the losses of the Great Recession entirely. This more than a decade long trend is now the norm. Homeowners are not moving as often as they used to.
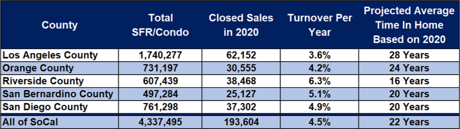
Based upon 2020 closed sales, the turnover rate for the Orange County’s housing stock is once every 24 years, down slightly from 2019’s once every 25 years. It has bounced between 20 years and 25 years for the past decade. Remarkably, only 4.1% of all homeowners opted to sell their homes last year.
There are many reasons why homeowners in Orange County and across the nation are opting to stay put. After feeling the burn from the Great Recession, many are turning their homes into “Forever Homes.” Most homeowners have refinanced to historically low interest rates, some as low as the mid-twos, making moving a lot more challenging as rates eventually rise.
Most baby boomers plan on staying put instead of downsizing after retirement. Even with the tax basis benefit created by Prop 19 this year, they are not moving like many had originally anticipated. They have been selling at a much slower pace than prior generations. This may be due to a longer life expectancy and a healthier lifestyle. They are happy just aging in place. And builders have not been building homes in the lower price ranges like they did in prior decades. These factors combined have contributed to the low turnover rate in the housing stock.
COVID-19 intensified the trend of fewer homeowners opting to sell. Last year in Orange County, 6% fewer homes were placed on the market compared to the prior 5-year average from 2015 to 2019. That translates to 2,535 missing FOR- SALE signs. That paved the way to 2021’s lowest active listing inventory since tracking began in 2004. Today, it is not COVID that is keeping homeowners from selling, it is the lack of replacement homes after selling. Many are pointing to the fact that if they sell there will be “nothing to buy,” limiting the number of homeowners willing to participate in a market with such an anemic level of available homes to purchase. In the first half of 2021, 8% fewer homes were placed on the market compared to the 5-year average from 2015 to 2019 (intentionally excluding 2020 due to COVID skewing the data), 1,829 fewer FOR-SALE signs.
Buyers must understand that the low turnover rate in the housing stock is here to stay. The pandemic did not help the issue either. This trend is here to stay, which means that the low housing inventory is not going to change much for the rest of the year and into 2022 as well. Most homeowners are simply content with staying put.
As a buyer, waiting for a lot more choices is futile. Buyers that opt to wait will be kicking themselves down the road. Instead, cashing in on today’s historically low rates now is the right move. The housing market has the legs to continue at its current trajectory for quite some time.
Active Listings
The current active inventory was nearly unchanged in the past couple of weeks.
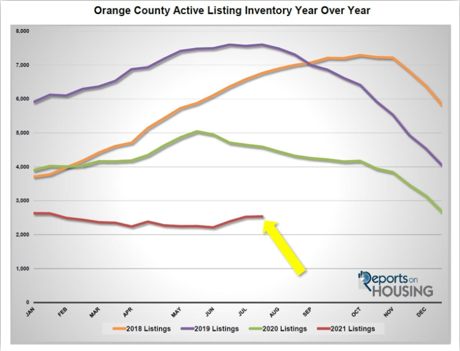
The active listing inventory added 9 homes in the past couple of weeks, nearly unchanged, and now sits at 2,537 homes, its highest level since January. This year is following a normal, cyclical, seasonal pattern with an increase in the active listing inventory during the Summer Market. Typically, during the Autumn Market, which starts at the end of August with the kids going back to school, fewer homeowners opt to place their homes on the market. It is more disruptive to a family in placing a home on the market after school resumes. This year may be a bit different as many homeowners may decide to take advantage of housing’s strength, which would mean that the active inventory would continue to climb and peak later in the year. The inventory typically peaks between July and August, but this year may be an exception. Only time will tell.
Last year at the end of July, there were 4,590 homes on the market, 2,053 additional homes, or 81% more. The 5-year average from 2015 to 2019 (intentionally omitting 2020 due to COVID skewing the data) is 6,916, an extra 4,379 homes, or 173% more. There were a lot more choices for buyers compared to today.
Demand
Demand increased by 2% in the past couple of weeks.
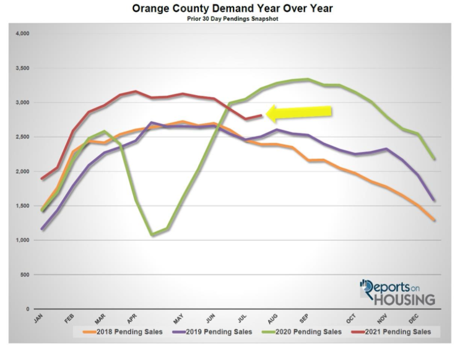
Demand, a snapshot of the number of new pending sales over the prior month, increased from 2,761 to 2,812 in the past couple of weeks, adding 51 pending sales, up 2%. It is still down 11% since peaking back on April 1st at 3,162 pending sales. Demand will continue to slowly descend from now through the Summer and Autumn Markets. It will then pick up steam and fall at a much faster pace during the Holiday Market beginning the week prior to Thanksgiving. As opposed to last year, Orange County demand is following a normal cyclical pattern this year, peaking during the Spring Market and then slowing dropping after reaching its peak.
Last year, demand was at 3,200, 14% more than today, with the arrival of a very late Spring Market due to COVID. It is better to compare today’s market to the 5-year average for demand from 2015 through 2019, which was at 2,682 pending sales, 145 fewer pending sales, or 5% less than today.
With the inventory rising slightly and demand rising as well, in the past two-weeks the Expected Market Time (the number of days it takes a home to go from active to under contract) remained unchanged at an incredibly low 27 days, albeit its highest level since the start of February. It's still an extremely hot sellers market - which means there are a ton of showings, sellers get to call the shots during the negotiating process, multiple offers are the norm, and home values are rising rapidly. Last year the Expected Market Time was at 43 days and dropping. The 5-year average from 2015 through 2019 was at 78 days, much slower than today, but still a Slight Seller’s Market.
If you or someone you know is thinking of buying or selling a property, please contact us today at 949-444-1601. Our team is here to help you every step of the way - that includes figuring out where you want to be, logistics of moving, cleaning up and preparing, helping with financing, and anything else you may need. Taking care of our clients (not just the transaction) is our #1 priority.