Area Real Estate News & Market Trends

You’ll find our blog to be a wealth of information, covering everything from local market statistics and home values to community happenings. That’s because we care about the community and want to help you find your place in it. Please reach out if you have any questions at all. We’d love to talk with you!

July 29, 2025

August 2022 Canyon Crest Market Update - The New Normal


Boy, has the market changed in the past few months. Back in April, a property wouldn't stay on the market for more than a few days, and now we are looking at an average of 67 days on markets. The looming recession has buyers on the edge of their seats fully aware that the housing market has slowed considerably. From the flood of online news articles describing the real estate slowdown to the countless YouTube and TikTok videos detailing in only a few minutes how housing is about to crash, many buyers are convinced that the Orange County housing market is on the brink of collapse. Homes are taking a lot longer to sell. The number of price reductions has surged higher in the past couple of months. As a result, many buyers sit on the sidelines waiting for prices to plunge. They are waiting for a deal, a total bargain. Simply put, that is not going to happen. The market is, and will likely remain a slight seller's market through the end of year.


What does that mean?


That means that prices are not going to drop. They are going to remain stable. But, it does also mean that we aren't going to see the bidding wars that were ever-present in the first quarter of this year. 


In April/May, we hit what I like to call "an unrealistic peak." Buyers were willing to throw more money than anyone could fathom because they had access to a low-interest mortgage rate. They had to make an insane offer to stand out as a clear winner from the 10's of competing offers. The property on Deerbrook selling for $2.36m and then the Peartree property selling for $2.3m were buyers needing to rise to the top of the offer heap...those sales prices are more than anyone in our community could have ever imagined for a tract home. 


Those April/May prices are gone. Homes are now closer to the February sales prices - which are still amazing prices! But price reductions are quite common in today’s market. There are fewer multiple offer situations (if any), and most homes are selling below their asking prices. This is a “normal” market.


The issue is that nobody has experienced a normal market in several years. It is hard to recall when housing was just ordinary. The key to selling your property in a "normal" market is to price your home at fair market value.  Fair market value takes into consideration any upgrades you have (or haven't) made to the property and compares that to most recent sales. Buyers are looking for remodeled/upgraded homes - those are selling faster than homes that need updates.  


Need help determining how your home compares? That is where I come in!


I don't merely market, list, and sell your home. I am a consultant who helps you understand your options, helps create a plan that accounts for your particular wants and needs and then executes the plan with a precision that exceeds your expectations. 


Contact me now and get the best team in the business working for you!


See for yourself what is going on in the Canyon Crest market:


What's currently for sale?

Click here to see properties that are currently active

What properties are in escrow (under contract or pending)? 

Currently, there are no properties in escrow


What properties have sold in the past 30 days? 

Click here to see properties that have sold recently


What properties have sold in the past 6 months?

Click here to see the properties that sold in the past 180 days


Have questions?

Want more information?

Click on the envelope icon above to reach out via email or the phone icon to call directly


Click Here to Find Out What Your Property is Worth


Posted in seller information
July 29, 2025

September 2022 Canyon Crest Market Update - Slowest Time of the Year


With the start and settling into the new school year, traditionally August, September, and October are the slowest real estate activity months in Mission Viejo. Obviously, the past 2 years have been unique with COVID and the incredibly low-interest rates. But as we find ourselves with our "new normal" interest rates in the 5% range and COVID scares on the decline, we have moved back into our traditional real estate cycle.


Things haven't changed since last month: Homes are taking a lot longer to sell. The number of price reductions has surged higher in the past couple of months. As a result, many buyers sit on the sidelines waiting for prices to plunge. They are waiting for a deal, a total bargain. And simply put, that is not going to happen. 


In April/May, we hit what I like to call "an unrealistic peak." Buyers were willing to throw more money than anyone could fathom because they had access to a low-interest mortgage rate. They had to make an insane offer to stand out as a clear winner from the 10's of competing offers. The property on Deerbrook selling for $2.36m and then the Peartree property selling for $2.3m were buyers needing to rise to the top of the offer heap...those sales prices are more than anyone in our community could have ever imagined for a tract home and those sales prices no longer exist. 


Listings in our community are expiring (ie. being taken off the market because they are not selling). Listings are lowering their price. Listings are sitting for 100+ days. This may sound doom and gloom, but this is our new reality exacerbated by the higher interest rates, inflation and seasonality of the market.


The issue is that nobody has experienced a normal market in several years. It is hard to recall when housing was just ordinary. The key to selling your property in a "normal" market is to price your home at fair market value.  Fair market value takes into consideration any upgrades you have (or haven't) made to the property and compares that to most recent sales. Buyers are looking for remodeled/upgraded homes. Those are selling faster than homes that need updates.  


Need help determining how your home compares? That is where I come in!


I don't merely market, list, and sell your home. I am a consultant who helps you understand your options, helps create a plan that accounts for your particular wants and needs and then executes the plan with a precision that exceeds your expectations. 


Contact me now and get the best team in the business working for you!


See for yourself what is going on in the Canyon Crest market:


What's currently for sale?

Click here to see properties that are currently active

What properties are in escrow (under contract or pending)? 

Currently, there are no properties in escrow 


What properties have sold in the past 30 days? 

Zero properties have sold in the past 30 days


What properties have sold in the past 6 months?
Click here to see the properties that sold in the past 180 days


July 29, 2025

Canyon Crest Ice Cream Social

Saturday, September 24th from noon - 4pm


Yes, free ice cream for you! As a thank you to the neighborhood for all of your support over the years, I want to share with you a little last taste of summer.
Listen for the Music of the Ice Cream Truck as we drive down each street in the community from noon - 3 PM starting at the Rustic Oak gate. We will be parked at the Clubhouse from 3 PM - 4 PM for anyone we missed!

If you have any questions, please feel free to email me or call me at 949-444-1601.

*This event was approved by HOA Board and is provided by Leslie Swan of The Swan Team and Alan Ouye of Guaranteed Rate.

Posted in Blogs
July 29, 2025

Canyon Crest Proposed Rule Change for Artificial Turf


Proposed Rule Change for Artificial Turf in
Canyon Crest
You may have noticed in our most recent Canyon Crest HOA mailing that there are proposed artificial turf regulations to supersede the regulations already in place. The new rules have very specific stipulations about how artificial turf can be used - including but not limited to artificial turf shall not be installed closer than 24" to the community sidewalk and must have a defined permanent barrier at least 4" in width. 

I asked our HOA managers, Otis & Associates why this rule change has been proposed. Here is the response I received from Kathy at Otis HOA:

"There has been a steep rise in the requests by homeowners to install artificial turf in Canyon Estates.  Driving through the community, the Architectural Review Committee (ARC) noted that some installations look better than others.  They thought that some installations just looked like a big green rug and going over property lines. By restricting the amount of artificial turf and keeping plants, trees, etc. it would maintain a more natural look – retaining the premier status of the Canyon Estates community."

It makes sense that there has been an increase in artificial turf requests considering the drought conditions and threatened water restrictions. What are your thoughts about this proposed rule change?

Email me at leslie@theswanteamoc.com with your thoughts, as I have plenty of my own. I plan to attend the October meeting to find out what the HOA board, architectural review committee, and homeowners have to say about this issue.

Posted in Market Updates
July 29, 2025

Top Reasons Homeowners Are Selling Their Houses Right Now


Some people believe there’s a group of homeowners who may be reluctant to sell their houses because they don’t want to lose the historically low mortgage rate they have on their current homes. You may even have the same hesitation if you’re thinking about selling your house.

Data shows 51% of homeowners have a mortgage rate under 4% as of April this year. And while it’s true mortgage rates are higher than that right now, there are other non-financial factors to consider when it comes to making a move. In other words, your mortgage rate is important, but you may have other things going on in your life that make a move essential, regardless of where rates are today. As Jessica Lautz, Vice President of Demographics and Behavioral Insights at the National Association of Realtors (NAR), explains:

Home sellers have historically moved when something in their lives changed – a new baby, a marriage, a divorce or a new job. . . .”

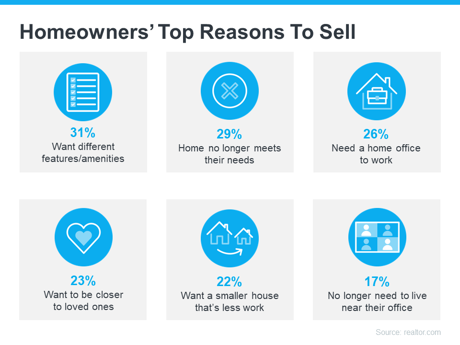
So, if you’re thinking about selling your house, it may help to explore the other reasons homeowners are choosing to make a move today. The 2022 Summer Sellers Survey by realtor.com asked recent home sellers why they decided to sell. The visual below breaks down how those homeowners responded:


As the visual shows, an appetite for different features or the fact that their current home could no longer meet their needs topped the list for recent sellers. Additionally, remote work and whether or not they need a home office or are tied to a specific physical office location also factored in, as did the desire to live close to their loved ones.

The realtor.com survey summarizes the findings like this:

The primary reason homeowners decided to sell in the last year was the realization that, after so much time spent at home, they wanted different features and amenities, such as walkability, outdoor space, pool, etc. . . . 

If you, like the homeowners they surveyed, find yourself wanting features, space, or amenities your current home just can’t provide, it may be time to consider listing your house for sale.

Even with today’s mortgage rates, your lifestyle needs may be enough to motivate you to make a change. The best way to find out what’s right for you is to partner with a trusted real estate professional who can provide expert guidance and advice throughout the process. They can help walk you through your options, so you can make a confident decision based on what matters most to you and your loved ones.

Bottom Line

While the financial reasons for moving are important, there’s often far more to consider. Non-financial reasons can also be a significant motivating factor. If you need help weighing the pros and cons of selling your house, let’s connect today.

July 29, 2025

Orange County Real Estate Update - October 2022


The High Rate Environment and Hunkering Down


Back in 1989, gas prices averaged 99¢. It reached $1.59 in 2000, jumped to $3.11 in 2010, and was nearly unchanged at $3.04 a decade later in 2020. However, in 2021, the price for a gallon of gas jumped from $3.26 in January to $4.60 by year’s end, a 41% increase. It was the largest rise since 2009. In 2022, gas prices soared even higher and sat at $6.40 to start October, up another 43%. Prices had nearly doubled since January 2021. From driving less to carpooling, to combining errands, to eating out less, at these levels, consumers have adjusted their behaviors.


It has been similar for housing, and an even larger adjustment in consumer behavior, as not only have home values surged higher but so have mortgage rates. The combination of the two has rippled throughout the housing market. In Orange County, according to the Federal Housing Finance Agency Home Price Index, home values rose annually by 4.3% in 2020, the first year of COVID, up 15.9% in 2021, and surged to 22% higher through the 2nd quarter of 2022. That’s when the median value of a detached home stretched to nearly $1.3 million, a mind-blowing 51% higher than January 2020’s $855,000 median. Home values had reached unbelievable heights.


In addition to values rocketing higher this year, so have mortgage rates. Upon ringing in the New Year, according to Freddie Mac’s Primary Mortgage Market Survey®, rates were at 3.22%. They surpassed 4% in March, 5% in April, 6% in September, and reached 6.7% last Thursday, more than double the start to 2022. The combination of higher rates and higher home values has completely flipped housing on its head and consumers have changed their approach to housing.


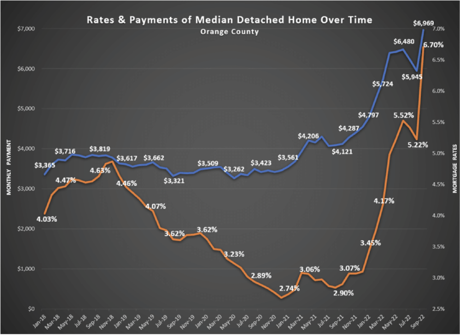
The ultra-low-rate environment and lack of available homes on the market, which reached record low levels in 2020 and 2021, allowed home values to escalate out of control.  Mortgage rates remained at record lows from April 2020, after the start of COVID, through the first week of this year, 21-months straight where they ranged between 2.65% to 3.5%. Despite increasing values, payments for the median priced detached home in Orange County increased from $3,509 in  January 2020 to $3,561 in January 2021, a rise of only $52 per month. 


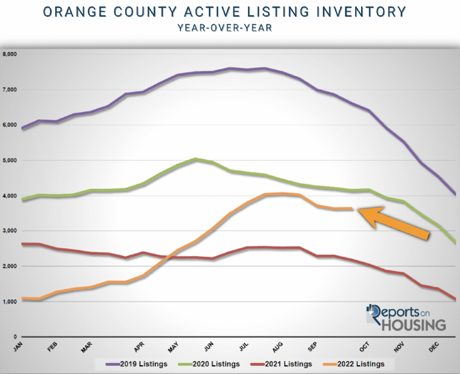
Unfortunately, rates remained low, and the inventory dropped to unprecedented levels. A peak of only 2,537 available homes was reached in July 2021, far below the 3-year average peak prior to COVID (2017 to 2019) of 6,959, a mind-blowing 64% less. The inventory had reached catastrophically low levels, which is why home values catapulted to astronomical heights. As a result, payments had reached $4,797 per month in January of this year. As rates shot higher in 2022, so did payments. March’s 4.17% rate and a $1.3 million detached median meant payments had grown to $5,724 per month. Payments stretched to $6,480 in June. As of the end of September, with rates at 6.7%, the payment had jumped to $6,969 per month. For perspective, that is an extra $3,460 per month, or $41,520 more per year, for the median priced detached home in September compared to the median-priced detached home in January 2020. 


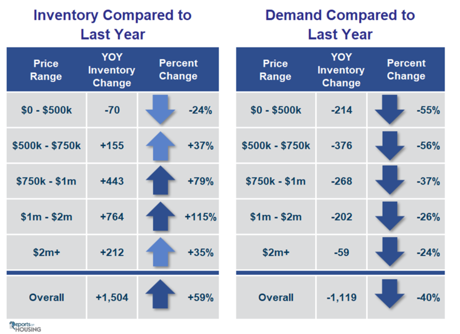
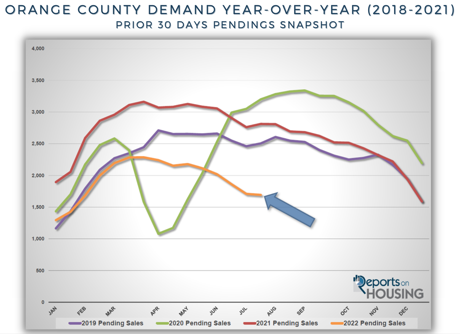
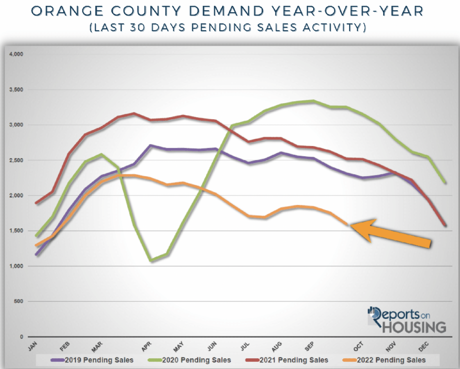
There are many consequences to sky-high rates. Demand has dropped to ultra-low levels. It is 37% lower than last year and 29% lower than the 3-year average prior to COVID. With fewer buyers in the marketplace, foot traffic is way down, OPEN HOUSE attendance is down considerably, multiple offers are the exception and not the rule, sales prices are normally below the asking price, and market times have increased substantially. Buyers are no longer waiving appraisals, waiving inspections, providing free rent backs to sellers, or paying substantially above asking prices. The fewer buyers that remain are taking their time and very carefully approaching the market. In the end, they are absorbing a much higher monthly payment, even with buying down the mortgage rate or going the adjustable-rate route. 


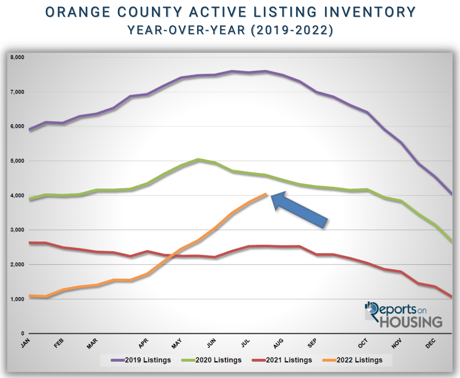
Typically, in a year where mortgage rates spike higher, the inventory climbs much higher as well. As homeowners come on the market monthly, they are greeted with muted demand. There are fewer success stories, so these sellers accumulate on the market and the inventory grows. With a rising inventory and dropping demand, market times grow, and it takes much longer to sell. That was the story in 2013 when rates rose from 3.34% at the start of the year to 4.57% in September. The inventory grew from 3,163 in January to its peak of 6,350 homes in October. A normal peak occurs between July and August, but in years where rates substantially rise, the peak is delayed into the Autumn Market as there are more sellers who languish on the market. 


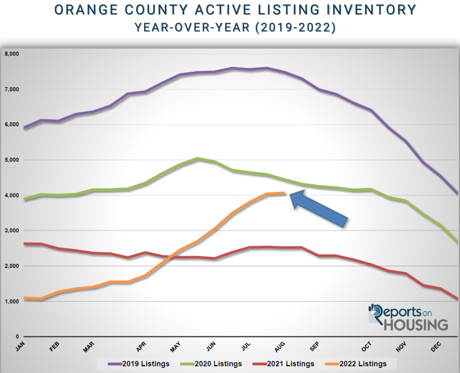
This year as rates exploded higher, the inventory grew from 954 homes at the start of the year to a peak of 4,069 at the start of August. It stopped rising early and has dropped to 3,646 today. As a result of sky-high rates homeowners are opting to not sell. They do not want to trade their incredibly low monthly mortgage payment where more than two-thirds of homeowners with a mortgage are enjoying a rate at or below 4%. Many homeowners are hunkering down and opting to stay even if they have an itch to make a move. In fact, there were 784 missing FOR-SALE signs in July, 21% fewer, 1,051 missing signs in August, 30% fewer, and 728 missing in September, 24% fewer. The lack of new sellers is preventing the inventory from growing despite demand falling an additional 13% in the past four weeks. 


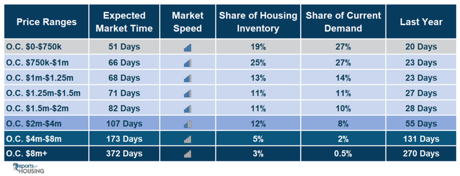
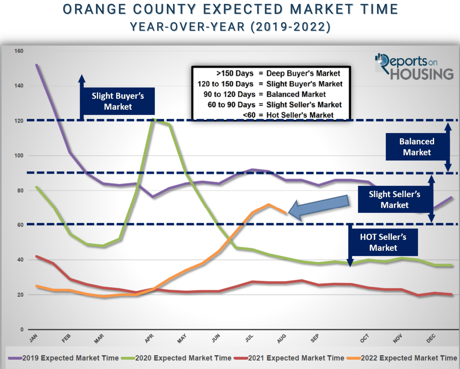
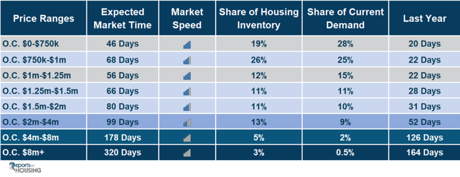
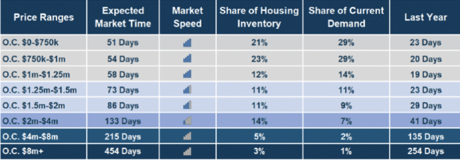
The Expected Market Time, the amount of time between coming on the market to opening escrow, has grown from 19 days in March to 68 days today. Normally, anything between 60 and 90 days is considered a Slight Seller’s Market where sellers get to call more of the shots, there are not as many multiple offers, and home values are only rising slightly. Between 90 and 120 days is a Balanced Market that does not favor buyers or sellers during negotiations and values do not change much. Between 120 and 150 is a Slight Buyer’s Market where buyers get to call more of the shots and home values drop only a bit. Above 150 days is a Deep Buyer’s Market where buyers call the shots and values are dropping. 


Yet, this supply and demand model is broken due to today’s unaffordability levels. The further rates surged above 5%, after lingering below 3.5% for so long, the more the pool of prospective buyers evaporated. The remaining buyers are not interested in paying the frothy prices of earlier in the year. They do not want to continue to stretch prices to record territories either. They want to pay the Fair Market Value of a home based upon its condition, location, age, upgrades, and amenities, ignoring buyers who paid tens of thousands of dollars more than the asking price, and even hundreds of thousands of dollars more, during the first half of 2022. According to the Case-Shiller Home Price Index, and other indexes that more accurately determine values than just looking at monthly median sales price, home values started retreating in May. 


As long as the sky-high mortgage rate environment continues, expect demand to remain muted, values to slowly drop, and fewer homeowners willing to participate in today’s housing market as they continue to hunker down. 


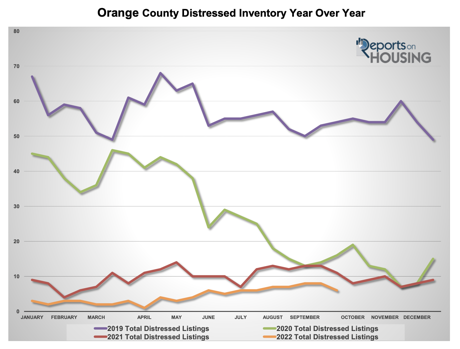
Bonus Info: For those of you wondering about the short sales and foreclosures, please see the chart below of distressed listings. 


{Source: Reports on Housing}


Have questions? Contact us at 949-444-1601 or email info@theswanteamoc.com.

July 29, 2025

Buyer's Opportunity - The 2-1 Temporary Buydown


With interest rates in the high 6% range, quite simply, you don't get as much for your money. 


But there is hope! It is called the 2-1 Temporary Buydown and has helped many buyers and sellers close escrow in this sluggish market.


What is a Temporary Buydown?

A temporary buydown is a mortgage option wherein the payment is reduced as the rate is “bought down” for the first year or two of the mortgage. For example, on a 2-1 buydown, the interest rate is 2% lower than the note rate the first year and 1% lower the second year.


The Buydown is typically funded by a seller or builder credit, also known as an Interested Party Contribution. Temporary buydowns have been around for years but fell out of fashion with the creative financing of the 2010s and the low-interest rates of the 2020s.


How Does It Work?

Once the note rate is set, a buydown cost is established by taking the payment at the note rate and subtracting the payment at the “bought down” rate.  We annualize this difference.  We do that for each year of the buydown and add these “costs” together.  This establishes the total buydown cost.


The buydown cost is typically paid by the seller or builder in the form of an Interested Party Contribution (IPC), i.e., a “seller credit.” The buyer may not pay for a Temporary Buydown. 


These funds are held in a custodial account by the lender and during the buydown period, the buyer pays at the lower “bought down” rate while the lender advances the difference between the bought down payment and full note payment to the servicer.


At the end of the buydown period, the borrower pays the remaining payments at the full note rate.


Here is an example of a 2-1 Buydown:


Sales Price: $750,000

Down Payment: 20%

Loan Amount: $600,000

Note Rate: 5.00%

Payment: $3,220.93


The amount required to fund the buydown is 1.68% of the sales price and meets the Interested Party Contribution maximum for all agencies. (IPC calculation: $12,573 ÷ $750,000 = 0.0168)


For more information, please contact Mike Wright directly at 714-536-2200 x 102 or email mwright@arborfg.com.

Posted in Blogs, Market Updates
July 29, 2025

3 Graphs Showing Why Today’s Housing Market Isn’t Like 2008

With all the headlines and talk in the media about the shift in the housing market, you might be thinking this is a housing bubble. It’s only natural for those thoughts to creep in that make you think it could be a repeat of what took place in 2008. But the good news is, there are concrete data to show why this is nothing like the last time.


There’s Still a Shortage of Homes on the Market Today, Not a Surplus

For historical context, there were too many homes for sale during the housing crisis (many of which were short sales and foreclosures), and that caused prices to fall dramatically. Supply has increased since the start of this year, but there’s still a shortage of inventory available overall, primarily due to almost 15 years of underbuilding homes.

The graph below uses data from the National Association of Realtors (NAR) to show how the months’ supply of homes available now compares to the crash. Today, unsold inventory sits at just a 3.2-months’ supply at the current sales pace, which is significantly lower than the last time. There just isn’t enough inventory on the market for home prices to come crashing down like they did last time, even though some overheated markets may experience slight declines.


Mortgage Standards Were Much More Relaxed Back Then

During the lead-up to the housing crisis, it was much easier to get a home loan than it is today. Running up to 2006, banks were creating artificial demand by lowering lending standards and making it easy for just about anyone to qualify for a home loan or refinance their current home.

Back then, lending institutions took on much greater risk in both the person and the mortgage products offered. That led to mass defaults, foreclosures, and falling prices. Today, things are different, and purchasers face much higher standards from mortgage companies.

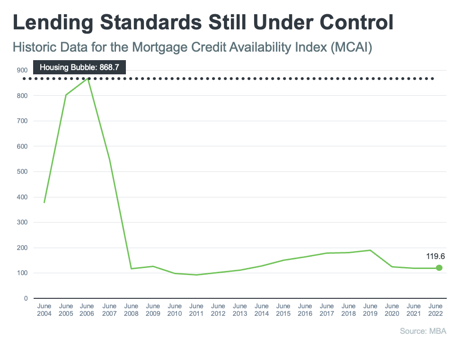
The graph below uses Mortgage Credit Availability Index (MCAI) data from the Mortgage Bankers Association (MBA) to help tell this story. In that index, the higher the number, the easier it is to get a mortgage. The lower the number, the harder it is. In the latest report, the index fell by 5.4%, indicating standards are tightening.


This graph also shows just how different things are today compared to the spike in credit availability leading up to the crash. Tighter lending standards over the past 14 years have helped prevent a scenario that would lead to a wave of foreclosures like the last time.


The Foreclosure Volume Is Nothing Like It Was During the Crash

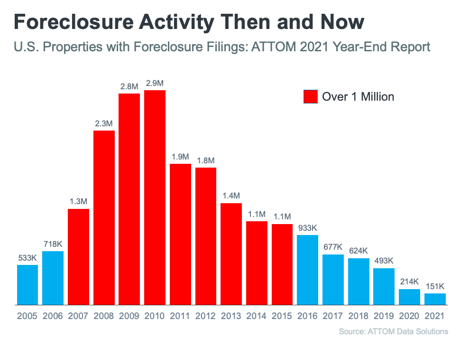
Another difference is the number of homeowners that were facing foreclosure after the housing bubble burst. Foreclosure activity has been lower since the crash, largely because buyers today are more qualified and less likely to default on their loans. The graph below uses data from ATTOM Data Solutions to help paint the picture of how different things are this time:


Not to mention, homeowners today have options they just didn’t have in the housing crisis when so many people owed more on their mortgages than their homes were worth. Today, many homeowners are equity rich. That equity comes, in large part, from the way home prices have appreciated over time. According to CoreLogic:

“The total average equity per borrower has now reached almost $300,000, the highest in the data series.”

Rick Sharga, Executive VP of Market Intelligence at ATTOM Dataexplains the impact this has:

“Very few of the properties entering the foreclosure process have reverted to the lender at the end of the foreclosure. . . . We believe that this may be an indication that borrowers are leveraging their equity and selling their homes rather than risking the loss of their equity in a foreclosure auction.”

 This goes to show homeowners are in a completely different position this time. For those facing challenges today, many have the option to use their equity to sell their house and avoid the foreclosure process.


Bottom Line

If you’re concerned we’re making the same mistakes that led to the housing crash, the graphs above should help alleviate your fears. Concrete data and expert insights clearly show why this is nothing like the last time.

July 29, 2025

The Fed and It's Influence on Real Estate - November 2022 Market Update


All year long the Federal Reserve has been in the news. Inflation had become enemy number one and they were going to do everything in their power to tamp down out-of-control inflation. Prices of goods, services, food, and energy were climbing at an unhealthy rate. Home values had soared by over 40% in just two years. 


In June, after delivering his prepared press conference remarks, Jerome Powell was asked about their outlook for the housing market. He stated that housing needed “a bit of a reset.” During the September press conference, a reporter asked for him to elaborate on what he meant by a housing “reset.” He did just that:

  • An end to the swift rise in home prices where homes were selling way over their asking prices.
  • For supply and demand to get better aligned so that home values did not skyrocket higher.
  • Help bring home prices more in line with rents and other housing fundamentals.
  • The housing market would have to go through a correction to get to that place, a better balance.

In economic terms, a correction typically means that home values drop between 10% to 20% from the peak. That peak occurred in May and prices have been on the decline in Southern California ever since. The issue is that mortgage rates have climbed at an unprecedented pace this year in response to all the Fed’s actions and statements, climbing from 3.22% at the start of January to 7.08% today, according to Freddie Mac’s Primary Mortgage Market Survey®. In the over 51 years in conducting the survey, mortgage rates have never climbed this much in a year, surpassing the prior record annual gain in 1981.


Powell just announced this afternoon another three-quarters of a point rate hike.


For perspective, the monthly payment on a $900,000 mortgage has increased from $3,902 on January 6th when mortgage rates were 3.22%, to $6,036 today at 7.08%. That is an increase in payment of $2,134 per month, or $25,608 per year. Affordability has taken a giant hit and the pool of prospective buyers interested in purchasing has shrunk noticeably. 


Demand, a snapshot of the number of new escrows over the prior month, has dropped to levels last seen during the initial pandemic lockdowns of April 2020, reminiscent of the start of the Great Recession. Today’s demand is at 1,270 pending sales, 48% less than last year’s 2,429 hot October reading. The 3-year average prior to the pandemic (2017 to 2019) was 2,180, an astonishing 72% more than today. 


The supply of homes has increased dramatically after starting the year at record low levels, increasing from 954 homes on January 1st to 3,677 homes today, a 285% rise. It is up 97% compared to last year at this time but is well off the 3-year pre-pandemic average of 6,010 homes for this time of year. The inventory should have surpassed levels last seen in 2019, but it fell well short due to a lack of homeowners placing their homes on the market. So far this year there have been 6,198 missing FOR-SALE signs compared to the 3-year average number of homes placed on the market prior to COVID, 19% fewer. Homeowners are hunkering down and opting to stay put as they enjoy unbelievably low fixed mortgage payments. According to the Federal Housing Finance Agency, 71% of all Californians with a mortgage have a rate of 4% or lower, far below today’s 7.08% height.


Even though the supply of homes remains muted, uncharacteristically weak demand has resulted in the Expected Market Time, the amount of time between pounding in the FOR-SALE sign to opening escrow, climbing from a low of 19 days at the start of March to 87 days today. 


A market time of 87 days is not even close to the start of the Great Recession when it eclipsed 365 days back in 2007, but the lack of affordability has reached a crisis level and values are slowly declining regardless of the lack of available homes. Today’s buyers are sophisticated and cautious in their approach to the housing market. They are unwilling to stretch and will not overpay for a home. It all boils down to value and they will patiently wait for the right home to come along. 


For sellers, it is imperative to recognize that the Federal Reserve’s housing “reset” has arrived. Be prepared for mortgage rates to remain elevated until inflation moves in the right direction. Until then, demand will remain sluggish, market times will grow longer, and home prices will slowly and methodically decline. 


Bottom Line:

Rates are going to continue to increase, with the hopes that home prices will decrease. 


Buyers need to understand that their home values may go down if they buy right now, but that they will eventually flatten and increase again over time (perhaps 5 years or so.) Locking in at a 7% rate now might actually seem like a bargain if rates are at 9% next spring. Buyers should also check with their mortgage lenders to see if they have any programs that will allow them to “lock and shop” so that they don’t have to succumb to the ever-increasing rates. Always remember, homeownership is historically a great hedge against inflation. 


Sellers need to understand that buyers can’t afford what they could even just last month. Consider all offers and know that comparable properties and thus other offers one month from now will likely be less than those offers received today.

Posted in Blogs, Market Updates
July 29, 2025

Homeownership is Historically a Great Hedge Against Inflation


(iStock)


In an inflationary economy, prices rise across the board. Historically, homeownership is a great hedge against those rising costs because you can lock in what’s likely your largest monthly payment (your mortgage) for the duration of your loan.

That helps stabilize some of your monthly expenses. James Royal, Senior Wealth Management Reporter at Bankrateexplains:

A fixed-rate mortgage allows you to maintain the biggest portion of housing expenses at the same payment. Sure, property taxes will rise and other expenses may creep up, but your monthly housing payment remains the same.”


And with rents being as high as they are, the ability to stabilize your monthly payments and protect yourself from future rent hikes may be even more important.


When you rent, your monthly payment is determined by your lease, which typically renews on an annual basis.

With inflation high, your landlord may be more likely to increase your payments to offset the impact of inflation.

That may be part of the reason why a  survey from realtor.com shows 72% of landlords said they plan to raise the rent on one or more of their properties in the next year.


If you’re ready and able to do so, becoming a homeowner can provide lasting stability and a reliable shelter in times of economic uncertainty. The best hedge against inflation is a fixed housing cost. If you’re ready to learn more and start your journey to homeownership, contact us at 949-444-1601.